
How to Build a Monthly Profit and Loss Tracker in Google Sheets

Most small business owners can tell you what’s in the bank. Far fewer can tell you what they actually earned last month.
That gap is where bad decisions happen. You hire because the account looks healthy, then discover the month was barely profitable. Or you panic over a thin balance when the business is doing fine.
A Google Sheets profit and loss template can help close this gap. It’s free to use and flexible, and you can build a basic monthly tracker in an afternoon.
In this guide, you’ll build a tracker that takes your raw transactions and turns them into a clean monthly summary: revenue, direct costs, gross profit, operating expenses and net profit before income tax. Every formula comes with exact cell references, and we’ll test the whole thing with a worked example.
If you’re still setting your spending limits, start with our guide to a small business budget. Then come back here to see how the real numbers compare.
What Is a Monthly Profit and Loss Tracker?
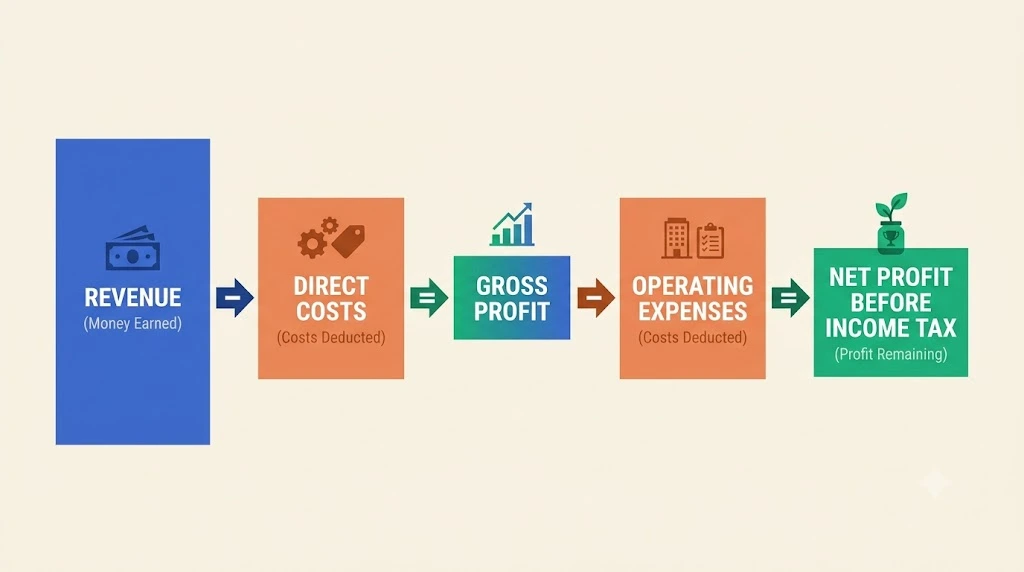
A profit and loss (P&L) tracker shows whether your business made money in a given month. It starts with what you earned and subtracts what it cost to earn it.
Three buckets do most of the work:
- Revenue: money from sales, after refunds.
- Direct costs: costs tied to the products or services you sold, such as materials, packaging and shipping.
- Operating expenses: the cost of running the business, such as rent, software, marketing and part-time help.
What it does: shows profit or loss for a month.
What it doesn’t do: show your cash balance, track unpaid invoices, or replace tax advice. We’ll come back to cash flow later in this guide.
Set Up Your Google Sheets Profit and Loss Template
You need two tabs. One holds every transaction. The other summarises a month.
Name them Transactions and Summary. The formulas below depend on those exact names.
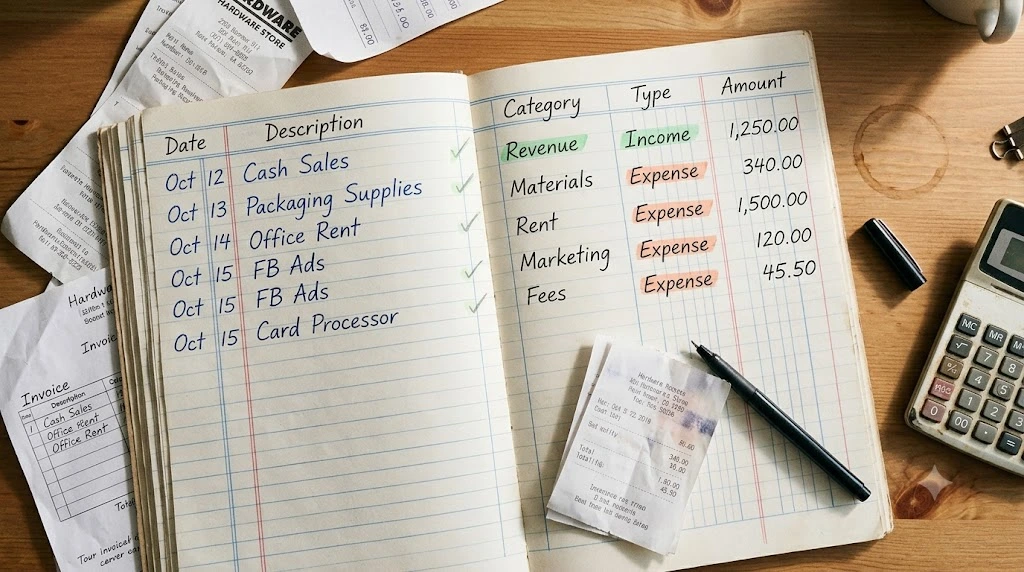
Create a Transaction Log
On the Transactions tab, use these five columns, with headers in row 1:
| Column | Header | What goes in it? |
|---|---|---|
| A | Date | The date that matches your chosen method (see below) |
| B | Description | A short note, like “Studio rent” |
| C | Category | Your own label, like “Materials” or “Marketing” |
| D | Type | One of five fixed types (see below) |
| E | Amount | A number. Always positive, except for refunds. |
Start entering data in row 2. Keep one transaction per row.
Pick One Accounting Basis and Stick to It
Before you log a single row, decide which method you’ll follow. Two are common:
- Accrual method: record revenue when it is earned and expenses when they are incurred, rather than simply using the date cash moves.
- Cash method: record transactions according to when money is received or paid, subject to the rules that apply to your business.
Neither method is automatically right for every business. The important thing is to use a consistent method and follow the rules that apply to your business.
This guide uses simplified accrual-style examples to explain monthly reporting. Inventory, unpaid bills, depreciation and other accounting adjustments may require additional treatment, so use this tracker as a basic management tool, not a substitute for formal accounts or tax advice. Confirm the appropriate accounting method and treatment with a qualified professional in your country.
Choose Consistent Income and Expense Categories
Column D (Type) is the engine of this tracker. Use exactly these five labels, spelt the same way every time:
- Revenue
- Direct Cost
- Operating Expense
- Other Income
- Other Expense
Type only the label itself. “Other Income” is for things like bank interest, and “Other Expense” is for things like loan interest, but those examples are explanations, not part of the label. If a cell contains anything other than the exact label, the SUMIFS formulas below won’t match it.
Column C (Category) is just for you. Use it to see where money goes, like materials, shipping or rent.
Two habits will save you headaches later:
- Record refunds as negative revenue. An $85 refund becomes -85 with the Type set to Revenue. It reduces revenue instead of hiding in your expenses.
- Keep personal spending out. If it isn’t a business transaction, it doesn’t belong in this sheet.
Pro tip: select column D, go to Data → Data validation, and add a dropdown with the five labels, exactly as written above. Typos stop being a problem.
Create a Monthly Summary
On the Summary tab, set up these labels in column A:
| Cell | Label |
|---|---|
| A1 | Month start |
| A2 | Month end |
| A4 | Total revenue |
| A5 | Direct costs |
| A6 | Gross profit |
| A7 | Operating expenses |
| A8 | Operating profit |
| A9 | Other income |
| A10 | Other expenses |
| A11 | Net profit before income tax |
| A12 | Gross margin |
Column B will hold the formulas.
Add Google Sheets Formulas to Calculate Monthly Profit
Now for the part that does the work. Every formula goes in column B of the Summary tab.
Calculate Results for a Selected Month
Start here, because every other formula depends on it.
In B1, enter the first day of the month you want to see. The safest way is the DATE function, which reads the same in every country:
=DATE(2026,9,1)
That means September 1, 2026. A typed date like 9/1/2026 can be read as January 9 in some regions, so avoid it here. Later, just change the numbers inside DATE to switch months.
In B2, enter:
=EOMONTH(B1,0)
This returns the last day of that month. Change B1 later, and the whole summary updates.
Format B1 and B2 as dates (Format → Number → Date) so you can read them easily.
Calculate Total Revenue
In B4, enter:
=SUMIFS(Transactions!$E$2:$E$1000, Transactions!$D$2:$D$1000, "Revenue", Transactions!$A$2:$A$1000, ">="&$B$1, Transactions!$A$2:$A$1000, "<"&($B$2+1))
Here’s what it says in plain English: add up the amounts in column E, but only where the type is “Revenue” and the date falls on or after the month start and before the day after the month end.
That last condition is deliberate. It still counts a transaction logged with a time of day on the last day of the month, such as an import that stamps 6:30 PM. A plain “less than or equal to the last day” test can miss those entries.
This is the Google Sheets SUMIFS formula at work: it adds up a range only when every condition you set is true. Google’s own SUMIFS documentation lists the full syntax if you want to go deeper.
Notice the range runs from row 2 to row 1000. Any transaction you add inside those rows is picked up without touching the formula. Past row 1000, though, new entries are ignored until you extend the ranges. You can do that by changing $1000 to a bigger number in every formula or by using open-ended ranges like that. Whichever you choose, keep all the ranges in each formula the same length.
Calculate Direct Costs and Gross Profit
In B5, use the same formula and swap the type:
=SUMIFS(Transactions!$E$2:$E$1000, Transactions!$D$2:$D$1000, "Direct Cost", Transactions!$A$2:$A$1000, ">="&$B$1, Transactions!$A$2:$A$1000, "<"&($B$2+1))
In B6, calculate gross profit:
=B4-B5
Gross profit is revenue minus direct costs. It tells you what’s left after paying for the things you sold.
In B12, add gross margin:
=IF(B4=0,0,B6/B4)
Format B12 as a percentage. Want to understand what a good number looks like? Our gross profit margin formula guide breaks it down.
Calculate Operating Profit and Net Profit.
In B7, pull your operating expenses:
=SUMIFS(Transactions!$E$2:$E$1000, Transactions!$D$2:$D$1000, "Operating Expense", Transactions!$A$2:$A$1000, ">="&$B$1, Transactions!$A$2:$A$1000, "<"&($B$2+1))
In B8, calculate operating profit:
=B6-B7
Now the extras that people forget. In B9 (other income):
=SUMIFS(Transactions!$E$2:$E$1000, Transactions!$D$2:$D$1000, "Other Income", Transactions!$A$2:$A$1000, ">="&$B$1, Transactions!$A$2:$A$1000, "<"&($B$2+1))
In B10 (other expenses):
=SUMIFS(Transactions!$E$2:$E$1000, Transactions!$D$2:$D$1000, "Other Expense", Transactions!$A$2:$A$1000, ">="&$B$1, Transactions!$A$2:$A$1000, "<"&($B$2+1))
And finally, in B11, your bottom line:
=B8+B9-B10
That’s your net profit (or loss) before income tax. If it’s negative, the business lost money that month.
Two limits are worth knowing. First, the tracker has no income tax line, so B11 is not a final “after everything” figure. Tax rules differ by country and business type, so ask a qualified professional how to treat it. Second, this profit is not the same as the cash the owner can take home. Owner withdrawals, tax payments, loan principal and unpaid invoices all affect real cash, and none of them are part of this calculation.
Download the ready-made spreadsheet: Download the Monthly Profit and Loss Spreadsheet Template to explore the sample transactions and automatic calculations in Google Sheets.
Monthly Profit and Loss Spreadsheet Example
Formulas make more sense with numbers. Let’s run a small, made-up business through the tracker.
The business below is fictional and used only for illustration.
This simplified example assumes the listed direct costs relate to the products sold during the month; inventory-based businesses may need additional adjustments.
Enter Sample Transactions
Meet Maple Lane Candle Co., a tiny online candle shop. Here’s what went into the Transactions tab (dates shown as year-month-day). The first and last rows belong to other months, on purpose, to prove the date filter works.
| Date | Description | Category | Type | Amount |
|---|---|---|---|---|
| 2026-08-29 | Wholesale order W-118 | Wholesale Sales | Revenue | 1,200 |
| 2026-09-02 | Online orders, week 1 | Product Sales | Revenue | 2,450 |
| 2026-09-04 | Wax and fragrance oil | Materials | Direct Cost | 640 |
| 2026-09-06 | Glass jars | Materials | Direct Cost | 310 |
| 2026-09-09 | Wholesale order W-121 | Wholesale Sales | Revenue | 1,800 |
| 2026-09-10 | Studio rent | Rent | Operating Expense | 900 |
| 2026-09-12 | Instagram ads | Marketing | Operating Expense | 350 |
| 2026-09-15 | Online orders, week 3 | Product Sales | Revenue | 2,100 |
| 2026-09-16 | Refund, order 1043 | Product Sales | Revenue | -85 |
| 2026-09-18 | Shipping labels | Shipping | Direct Cost | 275 |
| 2026-09-20 | Shopify and apps | Software | Operating Expense | 79 |
| 2026-09-22 | Packaging boxes | Packaging | Direct Cost | 180 |
| 2026-09-25 | Part-time helper | Labour | Operating Expense | 600 |
| 2026-09-27 | Payment processing fees | Fees | Operating Expense | 142 |
| 2026-09-28 | Bank interest | Interest | Other Income | 12 |
| 2026-09-30 | Loan interest | Interest | Other Expense | 65 |
| 2026-10-01 | Online orders, week 1 (Oct) | Product Sales | Revenue | 2,300 |
Review the Monthly Profit and Loss Statement.
Set Summary! B1 too. Amounts are in US dollars and are for illustration only. Here’s what the formulas return:
| Line | Cell | Result | How it’s calculated |
|---|---|---|---|
| Total revenue | B4 | $6,265 | 2,450 + 1,800 + 2,100 − 85 |
| Direct costs | B5 | $1,405 | 640 + 310 + 275 + 180 |
| Gross profit | B6 | $4,860 | 6,265 − 1,405 |
| Operating expenses | B7 | $2,071 | 900 + 350 + 79 + 600 + 142 |
| Operating profit | B8 | $2,789 | 4,860 − 2,071 |
| Other income | B9 | $12 | Bank interest |
| Other expenses | B10 | $65 | Loan interest |
| Net profit before income tax | B11 | $2,736 | 2,789 + 12 − 65 |
| Gross margin | B12 | 77.6% | 4,860 ÷ 6,265 |
The August and October rows are ignored, exactly as they should be. Change B1 to =DATE(2026,10,1) and the summary shows only the $2,300 October sale.
We recalculated this sample to confirm the totals. Your own sheet should match these numbers if you’ve entered the same rows.

A Real-World Look at the Same Idea
This setup isn’t just a classroom exercise. Real owners keep their books in Google Sheets too.
One example comes from the author of the personal finance blog Accidentally Retired, a former CEO who says they are not a CPA. The author built a profit and loss template in Google Sheets for their own LLC and says it has been in use for the past few years. They note that paid tools exist, but prefer to get hands-on with the data.
The routine is simple. Bank and credit card transactions are imported about once a month, which the author says takes roughly 20 minutes. Anything left uncategorized falls into a catch-all line, so nothing silently disappears. The author also says the P&L has helped catch spending issues and spot revenue trends.
You can read the original account on the Accidentally Retired profit and loss page. The takeaway is simple: a monthly routine beats a perfect system you never open.
How to Check Whether Your Google Sheets P&L Tracker Is Correct
A spreadsheet that looks right can still be wrong. Spend ten minutes testing it before you trust it.
Verify Monthly Totals
Choose a month and independently check the transactions recorded for that period against invoices, receipts, sales records and other supporting documents. Compare the verified figures with B4 (revenue), B5 (direct costs) and B7 (operating expenses).
If you use accrual accounting, a transaction may appear in the P&L in a different month from the related bank payment. For example, revenue earned in September but collected in October may belong in September’s P&L. Keep track of unpaid invoices and bills so you can explain these differences. Use bank and credit card statements to reconcile cash movements separately.
Investigate any unexplained difference. It could point to a missing transaction, a duplicate, an incorrect amount or a classification error.
Test the Formulas With a New Transaction
Add this row to the bottom of the example (amount in US dollars, for illustration):
| Date | Description | Category | Type | Amount |
|---|---|---|---|---|
| 2026-09-29 | Local market stall | Product Sales | Revenue | 420 |
Revenue should jump to $6,685, gross profit to $5,280, and net profit to $3,156. If your numbers move by exactly $420, your ranges are working.
Find Missing Entries and Duplicate Transactions
Add two safety checks at the bottom of the Summary tab.
In B14, add a reconciliation check:
=SUMIFS(Transactions!$E$2:$E$1000, Transactions!$A$2:$A$1000, ">="&$B$1, Transactions!$A$2:$A$1000, "<"&($B$2+1))-(B4+B5+B7+B9+B10)
Think of this as a classification check, not a full audit. It should show 0. If it doesn’t, a transaction in that month has a Type that doesn’t match one of the five labels. When we typed “Revnue” instead of “Revenue” in testing, this cell showed 420, which is exactly the missing amount.
It can’t catch everything. A transaction filed under the wrong valid Type, a duplicate row, a missing entry or a wrong amount will still pass with 0. That’s why the manual checks above still matter.
In B15, flag entries in the Amount column that aren’t numbers:
=COUNTA(Transactions!$E$2:$E$1000)-COUNT(Transactions!$E$2:$E$1000)
This counts filled cells that Sheets doesn’t read as numbers, such as an amount typed as text or a note typed into the wrong column. Blank cells are ignored. Treat a result above 0 as a prompt to look closer, not as a complete text detector.
Also scan for these four common problems:
- Duplicate rows (sort by date and amount to spot them)
- Gaps in dates that suggest missing entries
- Wrong categories
- Amounts that left-align, a sign Sheets sees them as text
Good records also mean keeping the paperwork behind each row. For US businesses, the IRS explains how to record your business transactions, including keeping a journal based on your supporting documents. That page is US guidance only. If your business is in another country, check your local tax authority’s rules. Nothing here is tax advice.
Common Profit and Loss Spreadsheet Mistakes
Most errors are small habits, not big blunders. Watch for these:
- Treating revenue as profit. Revenue is what came in. Profit is what’s left.
- Mixing personal and business transactions. It muddies every number.
- Misclassifying costs. Shipping a customer’s order is a direct cost. Your accounting software subscription is an operating expense.
- Formula ranges that stop short. If your range ends at row 50 and you’re on row 60, new rows are invisible.
- Recording refunds differently each time. Pick one method and stick with it.
Profit and Loss vs. Cash Flow
This surprises many owners: you can be profitable and still run short of cash.
Look back at the example. The $1,800 wholesale order on September 9 counts as September revenue. But if that customer pays in October, your September bank balance never saw the money. Profit says you did well. Your account says otherwise.
That’s the core difference. A P&L tracks when you earn and spend. Cash flow tracks when money actually moves.
Both matter. Use your P&L to judge performance, and watch cash separately to make sure you can pay bills on time. Our guide to cash flow improvement strategies shows you how to close that gap.
When Should a Small Business Move Beyond Google Sheets?
Google Sheets works well for a long time. But it has limits.
Consider moving to accounting software or a bookkeeper when:
- You’re logging hundreds of transactions a month and entering them by hand is a chore.
- You need bank reconciliation and a reliable audit trail.
- Several people edit the sheet and mistakes keep sneaking in.
- A lender, investor or accountant asks for formal statements.
Outgrowing a spreadsheet usually means the business is growing.
Frequently Asked Questions
How do I create a profit and loss tracker in Google Sheets?
Create a Transactions tab with Date, Description, Category, Type and Amount columns. Then build a Summary tab that uses SUMIFS formulas to total revenue, direct costs and expenses for a chosen month. Net profit is simply what remains after those subtractions.
What formula calculates monthly profit in Google Sheets?
Net profit before income tax equals operating profit plus other income minus other expenses. In this tracker that’s =B8+B9-B10, and each input comes from a SUMIFS formula that filters by Type and by date range. Income tax isn’t included, so ask a qualified professional how to handle it.
Can Google Sheets calculate net profit automatically?
Yes. Once your SUMIFS formulas and date range are in place, net profit before income tax updates every time you add a transaction or change the month in B1. In this setup that works for rows 2 to 1000. Beyond that, extend the ranges or use open-ended ones.
What should a small business include in a P&L spreadsheet?
At minimum: revenue, direct costs, gross profit, operating expenses, and net profit before income tax. Add other income and other expenses (like interest) so the result isn’t overstated. A gross margin line is a useful extra.
How often should I update my profit and loss tracker?
Monthly is a good rhythm for most small businesses. Weekly is better if your volume is high. Updating regularly keeps the work small and helps you catch mistakes while they’re easy to trace.
Can a Google Sheets P&L tracker replace accounting software?
For a very small business with simple transactions, it can work well. But it won’t give you automatic bank reconciliation or a built-in audit trail. As volume grows, accounting software or a professional bookkeeper is the safer choice.
Ready to Take Control of Your Numbers?
You don’t need fancy software to know whether your business is making money. You need a clean transaction log, five consistent labels, and a summary that updates itself.
Build the tracker this week. Enter last month’s transactions, run the checks, and see what the numbers say. Then make it a monthly habit.
If you want more practical guides on money, systems and growth for small businesses, explore more articles on GoFundScale.
This article is for general information only. It isn’t accounting, tax or legal advice. For decisions about your own business, talk to a qualified professional.