Gross Profit Margin Formula: How to Calculate It With Examples

The gross profit margin formula shows what percentage of revenue remains after subtracting the cost of goods sold (COGS). If you run a business, gross profit margin is one number you should never guess at. It tells you, in plain terms, how much money is actually left after you pay for what you sold—before rent, salaries, or marketing even enter the picture.
Here’s the formula, right away:
Gross Profit Margin = (Revenue − COGS) ÷ Revenue × 100
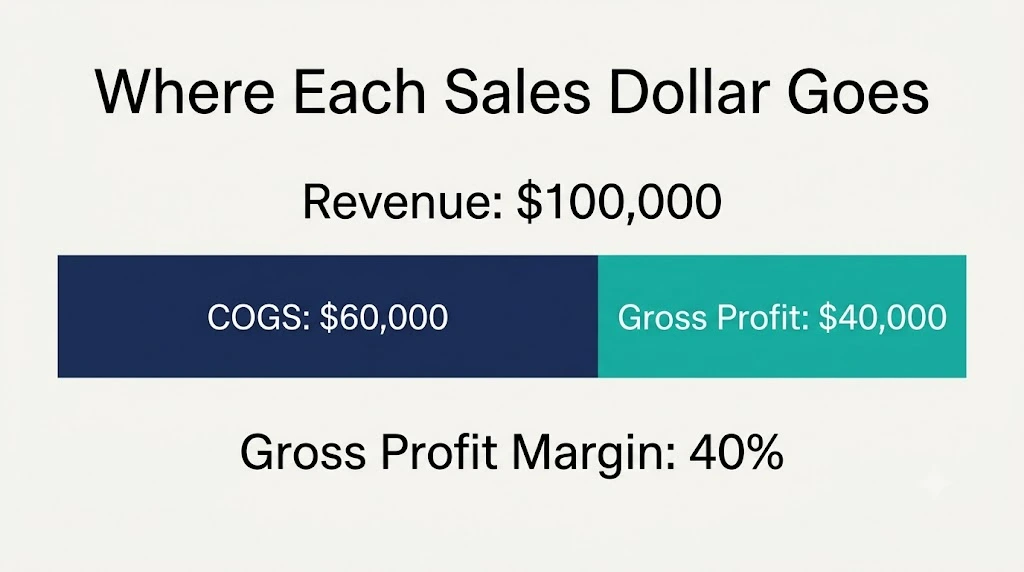
Quick example: a business with $100,000 in revenue and $60,000 in cost of goods sold (COGS) has a gross profit of $40,000—a 40% gross profit margin.
In this guide, you’ll learn exactly what goes into that formula, how to calculate it step by step, what counts as a “good” margin, and the mistakes that quietly throw the number off. By the end, you’ll be able to calculate your own margin in minutes—and actually trust it.
What Is Gross Profit Margin?
Gross profit margin is the percentage of revenue a business keeps after covering the direct costs of producing what it sells. It shows how much revenue remains after direct costs, before operating expenses and other costs are deducted.
Gross Profit vs. Gross Profit Margin
These two terms get mixed up constantly, so here’s the difference. Gross profit is a dollar figure. Gross profit margin is a percentage. If revenue is $50,000 and COGS is $30,000, gross profit is $20,000—and gross profit margin is 40%. One tells you how much money you made; the other tells you how efficient that sale was.
What Does Gross Profit Margin Tell You?
In practical terms, gross profit margin shows how much of every sales dollar survives after covering the direct cost of making or delivering the product. A higher margin means more room to cover overhead, reinvest, or absorb a slow month. A thin margin means less cushion—even if total revenue looks healthy on paper.
It’s also one of the fastest ways to spot a problem early. A declining gross margin can signal rising supplier costs, pricing pressure, or a shift toward lower-margin products—often long before it shows up in the bottom line.
Gross Profit Margin Formula
The core formula is simple:
Gross Profit Margin = (Revenue − COGS) ÷ Revenue × 100
You’ll also see it written this way, which means the exact same thing:
Gross Profit Margin = Gross Profit ÷ Revenue × 100
Both versions work because gross profit is just revenue minus COGS. Once you calculate gross profit, dividing it by revenue and multiplying by 100 gets you the percentage.
What Goes Into the Formula?
Revenue is the sales earned during the period you’re measuring. Depending on how your business reports sales, you may need to account for returns, refunds, discounts, or allowances when determining net sales.
Cost of Goods Sold (COGS) covers the direct costs tied to producing or delivering what you sold—materials, direct labor, manufacturing costs, or wholesale product costs.
Gross profit is simply revenue minus COGS: Revenue − COGS = Gross Profit.
What Should Not Be Included in COGS?
This is where a lot of businesses get their margin wrong. COGS should not include marketing spend, office rent, or administrative salaries—those are operating expenses, not direct costs of production. Interest payments and income taxes are also excluded from COGS, but they’re generally deducted separately rather than counted as operating expenses. Keep in mind that exact COGS classification can vary slightly by business type and accounting method, so it’s worth confirming yours with an accountant. For a closer look at how the IRS defines allowable COGS, see the IRS guide to cost of goods sold, and for general small-business financial guidance, the U.S. Small Business Administration is a solid reference.
How to Calculate Gross Profit Margin Step by Step
This is the part most people are here for—so let’s walk through it cleanly, one step at a time.
Step 1: Find Your Revenue
Start with net sales for the period you’re analyzing—a month, quarter, or full year. Subtract returns, refunds, discounts, and sales allowances from gross sales when these amounts are material and reported separately.
Step 2: Calculate Your COGS
Add the direct costs of producing or purchasing what you sold, such as raw materials, direct labor, manufacturing costs, and wholesale product costs. Include fulfillment costs only when your accounting method consistently classifies them as COGS.
Step 3: Calculate Gross Profit
Subtract COGS from revenue.
Step 4: Divide Gross Profit by Revenue
Take your gross profit figure and divide it by total revenue. This gives you a decimal.
Step 5: Multiply by 100
Multiply that decimal by 100 to convert it into a percentage—your gross profit margin.
Complete Example
Revenue: $100,000 COGS: $60,000
Gross profit: $100,000 − $60,000 = $40,000
Gross profit margin: $40,000 ÷ $100,000 × 100 = 40%
In plain terms: this business keeps $0.40 of gross profit for every $1 of revenue, before operating expenses are even considered.
How to Calculate Gross Profit Margin From Gross Profit
Sometimes you already know your gross profit and revenue but not the individual COGS figure—this happens often when you’re working from a summary report rather than raw numbers. In that case, you can skip straight to the margin.
Gross Profit Margin = Gross Profit ÷ Revenue × 100
Example: Revenue = $100,000, Gross Profit = $30,000.
Gross Profit Margin = $30,000 ÷ $100,000 × 100 = 30%
This shortcut is useful anytime your gross profit is already calculated for you, and you just need the percentage to compare against past periods or other products.
How to Calculate Gross Profit From Gross Profit Margin
This works the other way too. If you already know your gross margin percentage and your revenue, you can work backward to find the actual gross profit in dollars.
Gross Profit = Revenue × Gross Profit Margin
Example: Revenue = $200,000, Gross Profit Margin = 35%.
Gross Profit = $200,000 × 35% = $70,000
This reverse calculation is especially handy for forecasting—if you know the margin you’re targeting, you can estimate the dollar profit a projected revenue figure would actually deliver.
How to Use a Gross Profit Margin Calculator
Once you understand the formula, a calculator simply removes the manual math. All it needs are two inputs—revenue and COGS (or revenue and gross profit, using the shortcut above).
How to Calculate Gross Margin With a Calculator
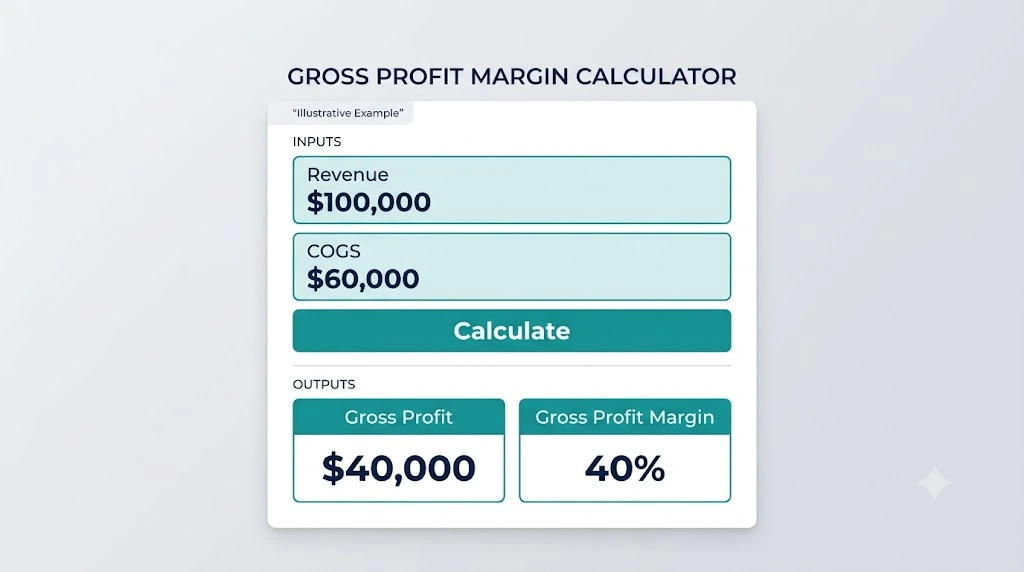
Enter your revenue and your COGS into any gross profit margin calculator. It will return your gross profit in dollars and your gross profit margin as a percentage, based on the same formula covered above—just without doing the arithmetic by hand.
Gross Profit Margin Calculator Example
Using the same numbers from earlier—$100,000 in revenue and $60,000 in COGS—a calculator would return a gross profit of $40,000 and a gross profit margin of 40%, matching the manual calculation step by step.
Gross Profit Margin Formula in Excel
If you’re working from a spreadsheet, Excel can calculate gross profit margin instantly once your revenue and COGS are entered.
Example Excel Formula
Suppose:
- B2 = Revenue
- C2 = COGS
- D2 = Gross Profit Margin
The formula in D2 is
=(B2-C2)/B2
Format the resulting cell as a percentage, and Excel will display your gross profit margin automatically. With revenue and COGS in separate columns like this, you can drag the D2 formula down the column to calculate margin across multiple months or products at once—useful for spotting trends without recalculating by hand each time. Note that if revenue is zero, the formula will return an error since margin is undefined in that case.
What Is a Good Gross Profit Margin?
There’s no single number that qualifies as “good” across every business—and that’s genuinely part of the answer.
Is a Higher Gross Profit Margin Always Better?
Not necessarily. A higher gross margin is generally helpful, but it doesn’t automatically mean the business is healthier—sales volume, operating costs, cash flow, and customer demand still matter.
Why Gross Profit Margins Differ by Industry
Retail businesses often run thinner margins than software or professional services, simply because of how much it costs to produce or source what’s being sold. Manufacturing, e-commerce, and SaaS businesses each carry very different cost structures, so comparing your margin only makes sense within your own industry.
How to Judge Your Gross Profit Margin
Instead of chasing an industry-wide benchmark, compare your margin against your own historical performance, similar products or services within your business, and the trend over time. A margin that’s improving quarter over quarter usually matters more than hitting an arbitrary percentage.
How to Calculate Gross Profit Margin for a Small Business
The formula stays identical for a small business—but the numbers, and what they reveal, tend to hit closer to home.
Gross Profit Margin Example for a Small Business
Monthly revenue: $25,000 COGS: $10,000 Gross profit: $15,000 Gross margin: 60%
Why Small Businesses Should Track Gross Margin
For a small business, gross margin directly shapes pricing decisions, which products or services to prioritize, and how much room there is to negotiate with suppliers. It’s also a foundational number for building a realistic budget and planning how the business scales.
Once you know your gross profit and gross margin, those numbers become the starting point for building a small business budget that actually reflects how your business really makes money.

Gross Profit Margin vs. Other Profitability Metrics
Gross margin is only one layer of profitability—here’s how it compares to the others.
Gross Profit Margin vs. Net Profit Margin
| Metric | Deducts | What It Tells You |
|---|---|---|
| Gross margin | COGS | Product/service-level profitability |
| Operating margin | COGS + operating expenses | Operating profitability |
| Net margin | Most business expenses | Final, bottom-line profitability |
Gross Profit Margin vs. Operating Profit Margin
Operating margin goes a step further than gross margin by also subtracting operating expenses like rent, salaries, and marketing—giving a fuller picture of how the business runs day to day. Gross margin tells you whether your product itself is profitable; operating margin tells you whether the business as a whole is being run efficiently around it.
Gross Margin vs. Markup
These two are frequently confused, but they’re calculated differently. If a product costs $60 and sells for $100, the gross margin is 40% (profit ÷ selling price), while the markup is 66.7% (profit ÷ cost). Same numbers, two very different percentages.
How to Improve Gross Profit Margin
Improving gross margin usually comes down to a handful of practical levers.
Raise Prices Strategically
Even a small, well-tested price increase can meaningfully lift margin without hurting demand.
Reduce Direct Costs
Renegotiating supplier contracts or sourcing more efficiently directly lowers COGS.
Review Your Product Mix
Shifting focus toward higher-margin products or services improves your blended margin over time.
Reduce Discounts and Unnecessary Returns
Excessive discounting quietly erodes margin—track how much it’s actually costing you.
Track Margin by Product or Service
Calculating margin at the individual product level, not just company-wide, reveals exactly where your profitability is strongest—and weakest.
Improving gross margin before increasing acquisition or operating spend can give a business more room to scale without putting unnecessary pressure on cash.
Common Gross Profit Margin Calculation Mistakes
A few recurring errors quietly distort this number more often than you’d expect.
Using Revenue Instead of Net Sales When Appropriate
Gross revenue and net sales (after returns and allowances) aren’t always the same—using the wrong one skews the result.
Putting Operating Expenses Into COGS
Administrative office rent, marketing, and admin salaries don’t belong in COGS—including them inflates your apparent costs and understates your true margin.
Mixing Different Accounting Periods
Comparing this month’s revenue to last quarter’s COGS produces a number that means nothing. Keep the time period consistent.
Confusing Gross Profit With Gross Profit Margin
One is a dollar amount, the other is a percentage—using them interchangeably leads to real confusion in financial conversations.
Confusing Margin With Markup
As shown earlier, these produce different percentages from the same numbers. Mixing them up leads to mispriced products.
Assuming a Higher Margin Automatically Means a Better Business
A high margin with very low sales volume can still leave a business struggling. Margin matters alongside volume, not instead of it—a strong percentage on very few sales can still fall short of covering fixed costs.
Reducing direct costs and focusing on your highest-margin offerings also plays directly into how to scale a small business without increasing operating costs.
Frequently Asked Questions About Gross Profit Margin
What is the formula for gross profit margin?
Gross Profit Margin = (Revenue − COGS) ÷ Revenue × 100.
How do you calculate gross profit margin?
Subtract COGS from revenue to get gross profit, divide that by revenue, then multiply by 100 to get a percentage.
What is a good gross profit margin?
It depends heavily on your industry. Rather than chasing a universal number, compare your margin to your own historical trend and to similar businesses in your sector.
What is the difference between gross profit and gross profit margin?
Gross profit is a dollar amount (Revenue − COGS). Gross profit margin is that same figure expressed as a percentage of revenue.
Is gross profit margin the same as markup?
No. Margin is calculated against selling price; markup is calculated against cost. The same numbers produce two different percentages.
How do you calculate gross profit margin in Excel?
Enter revenue and COGS into two cells, then use the formula =(Revenue-COGS)/Revenue and format the result as a percentage.
Can a small business have a high gross profit margin but still lose money?
Yes. A strong gross margin can still be outweighed by high operating expenses, meaning the business shows a net loss despite healthy gross profitability.
Final Takeaway
Gross Profit Margin = (Revenue − COGS) ÷ Revenue × 100
Calculate it consistently, track how it trends over time, and compare it against your own business rather than a generic industry average. Just as important—don’t confuse it with net profit, which tells a very different story once all your other expenses are factored in.
Next, calculate your small-business break-even point to see how much revenue you need to cover both direct and operating costs.